
The 10 KPIs that actually tell you where your Salesforce org hurts
Or: why org-wide averages lie, and why a per-process lens is the only level at which audit turns into action.
Salesforce orgs don't get complex. They accumulate.
Every mature Salesforce org tells the same story. It started clean. Then, over ten years, someone added one more record type for a new business unit. A new profile for a new role. A validation rule for an edge case that turned out not to be an edge case. A flow for the exception the trigger couldn't handle. A page layout for the VIP segment. Another record type to handle the same thing in APAC.
Nobody made a bad decision. And yet, one day, nobody in the room can answer a simple question: where is the weight actually sitting?
That question is the entire reason Stood Flows exists.
The default instinct is to answer it at the org level — "we have 4 million records," "our APEX is 13 million characters," "we have 250 profiles." Those numbers are true and useless. They average the processes that carry the whole business together with the ones that handle twelve records a year. Averages hide everything that matters.
The right level of slicing is the process — one record type, one lived business reality. That's the level where audit becomes action.
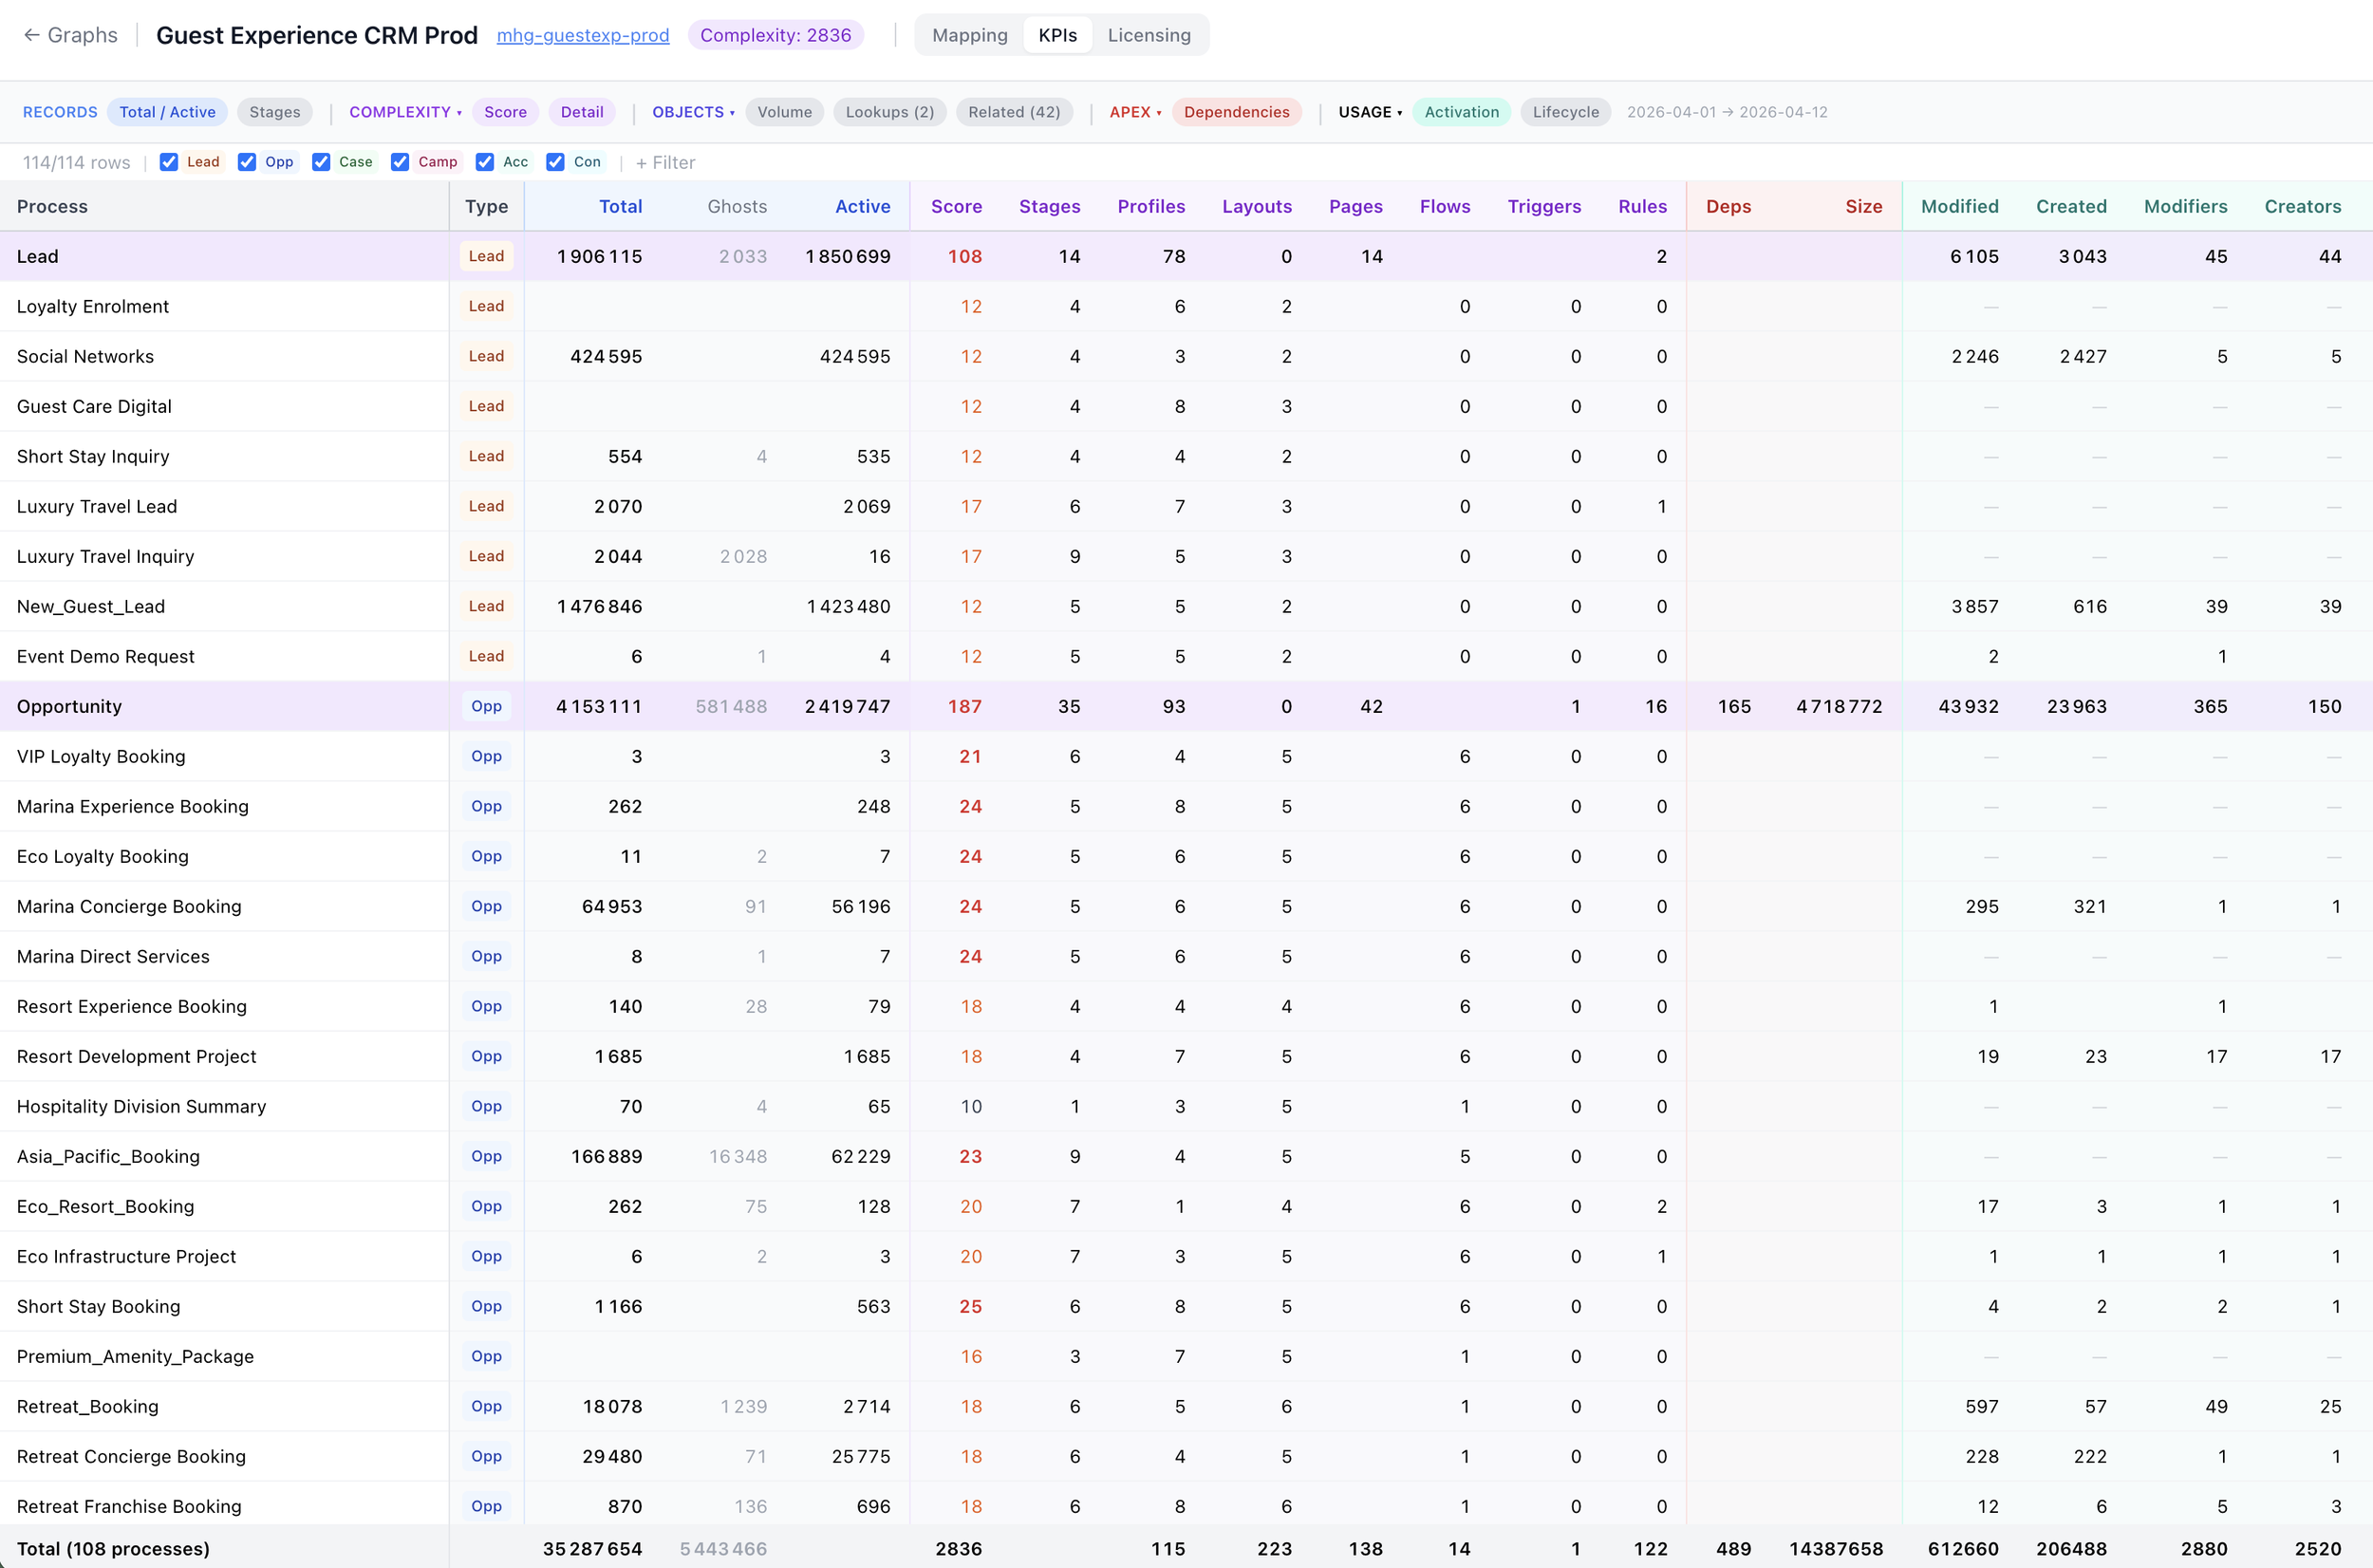
Below are the ten KPIs we compute per process, every time, and why each one matters.
0. Business Process Volume — the honesty check
Before any score, count. How many distinct business processes is the org carrying on its backbone objects (Lead, Opportunity, Case, Account, Contact, Campaign)?
Most leadership teams estimate 15–25. The real number, on any org older than five years, is 80 to 150. That gap is the single most revealing KPI in the entire exercise. It tells you whether your CRM has been curated or merely accumulated.
If the number is a surprise, the rest of the audit will be too.
1. Complexity Score — one number to rank on
A composite, computed per process: stages, profiles, layouts, Lightning pages, flows, triggers, validation rules. Each dimension contributes weighted points.
Why a composite? Because complexity is never one thing. A process can be heavy through its stages (too many), its profiles (too broad), its flows (too tangled), or its APEX (too coupled). A single score lets you rank 108 processes on one axis and decide where to look first without losing the dimensions underneath.
The score is diagnostic, not punitive. High scores are sometimes justified — Opportunity should be more complex than a holiday-card process. The value is in the outliers: where the score is high and the volume is low.
2. Total vs. Active Records — the first honesty check, at process level
Total is what's stored. Active is what was created or modified in the rolling window. The gap is usually embarrassing.
We regularly see processes with hundreds of thousands of records where the active count over 30 days is single-digit. That's not a process; that's an archive pretending to be a process. It still consumes layouts, profiles, picklists, validations and flows — all maintained as if they mattered.
Active is the only column that maps to real operational work. Everything else is decoration.
3. Ghost Records — invisible weight
Ghosts are records stuck on picklist values that have been deactivated. They don't show up in the default reports because the reports filter on active values. They do show up in storage, in licence consumption, in export jobs, and in every integration that doesn't know better.
An org with 5% ghost records has a data-quality problem. An org with 15% has a cultural one — configuration changes happen on the surface, without anyone going back to clean the records that now live in limbo.
Ghosts are the cheapest KPI to fix and the one most teams have never measured.
4. Stages per Process — the unread diagram
Twenty-stage Opportunity processes aren't rare. They're just never read.
Every stage added over the years stays in the picklist, even when nobody uses it. Sales reps navigate by muscle memory through three or four of them; the rest sit in the dropdown, quietly collecting records from the one rep who still remembers why "Pending Internal Review 2" exists.
Counting stages forces the conversation: which of these stages carry records created in the last 90 days? The answer is almost always a short list.
5. Profile Count per Process — the #1 complexity driver
In every org we've scanned, profiles are the single biggest structural driver of complexity. It's common to find a record type configured with 110 profiles for 2 records — because the profiles were attached defensively, "just in case," years ago.
Profiles aren't free. Every profile multiplies the surface area of layouts, field-level security, permission matrices and release testing. Rationalising from 110 to 10 profiles on a low-volume record type is usually the highest-impact, lowest-risk move in the entire audit.
6. APEX Dependency Footprint — what can't move without pain
How many characters of APEX are wired into this process, directly or through dependencies?
This is the KPI that predicts which refactors will be cheap and which will be month-long. It surfaces the objects and triggers that behave as platforms — the ones five other processes quietly depend on. Those aren't bugs; they're architectural facts. But they need to be known before the next release plan is drawn.
7. Unique Creators / Modifiers — who actually touches this
A process "owned by Sales Ops" is nominally touched by 40 people. In the rolling window, the count of unique creators or modifiers is often 3 to 5.
That's not criticism — most processes don't need more. The value of the KPI is in the mismatch. When a high-complexity process has a tiny active user base, you're maintaining a cathedral for a congregation of four. That's either a redesign opportunity or a staffing signal.
8. Licensing — Assigned vs. Login vs. Active
Three layers, three very different numbers.
Assigned — licences attached to a profile. What procurement sees.
Login — profiles that have logged in at least once in 30 days.
Active — profiles that also created or modified records.
The gap between assigned and active is the refund request. On mature orgs it's routinely 40–60%. On the outskirts — unused add-ons like Einstein Agent, Field Service Scheduling, Trust Card Manager — it can be 100%, with tens of thousands of licences provisioned and zero in use.
Three layers, one question: which users should we re-onboard, and which licences should we retire?
9. Cost Allocated per Process — the budget conversation
Licence dollars pinned to the process that actually consumes them.
This is the moment the audit stops being a technical exercise and starts being a budget conversation. When "Retreat_Pricing_Case" shows up as a $2,200 line in a process-cost table, the question stops being "is this well configured?" and becomes "is this worth $2,200 this quarter?"
Most orgs have never seen this view. It changes the room.
10. Lifecycle Transitions — the map is not the territory
The last KPI compares how records actually move stage-to-stage with how the process diagram says they should.
Stage A → Stage B → Stage C is the official story. The data usually tells a messier one: records skip stages, loop back, get jumped directly to closed, or accumulate in a stage that was meant to be transient. Lifecycle transitions expose the delta between the intended process and the operated one.
That delta is where flows misfire, reporting lies, and coaching opportunities hide.
Why Stood Flows makes these actionable
Any consultancy can compute most of these numbers with a weekend of SOQL. The difference isn't the extraction — it's the slicing, the trusted structure and the cadence.
Per process, not per org. Org-wide averages hide the outliers that carry 80% of the pain. Stood Flows computes every KPI at the right level, so a score is attached to a business reality, not a platform abstraction.
Ranked and costed. Each KPI produces a sortable list with an estimated saving attached — complexity points, ghost records, licence dollars. The output is a backlog, not only a report.
Continuous, not annual. The analysis refreshes on demand. The same KPIs your architect uses to plan a refactor are the ones your ops lead reviews at the monthly steering. That's how audit becomes a control.
What it looks like on a real org
On a typical engagement, the ten KPIs combine into three things you can actually do:
Deactivate the tail. The 15–30 record types below the usage floor. Frees complexity points without touching live operations.
Re-onboard the unplugged tier. Users who are assigned but don't log in. One wave per business unit. Either they come back, or their seats retire.
Rebalance the licensing envelope by 30–40%. Retire shelfware add-ons, right-size core licences on active-modifier basis, reassign what's left to the processes that actually consume it.
Those three actions, driven by these ten KPIs, are what consistently deliver 30–40% licensing rebalance and 15–25% complexity reduction within a quarter — without a CRM migration, without a platform change, and without a six-month consultancy.
The point
The platform isn't the problem. The absence of a per-process lens is.
Salesforce is a good CRM. It becomes a bad one when nobody owns the continuous analysis of what it actually does. These ten KPIs — starting from the honesty check of how many processes the org even has — give you that ownership back.